


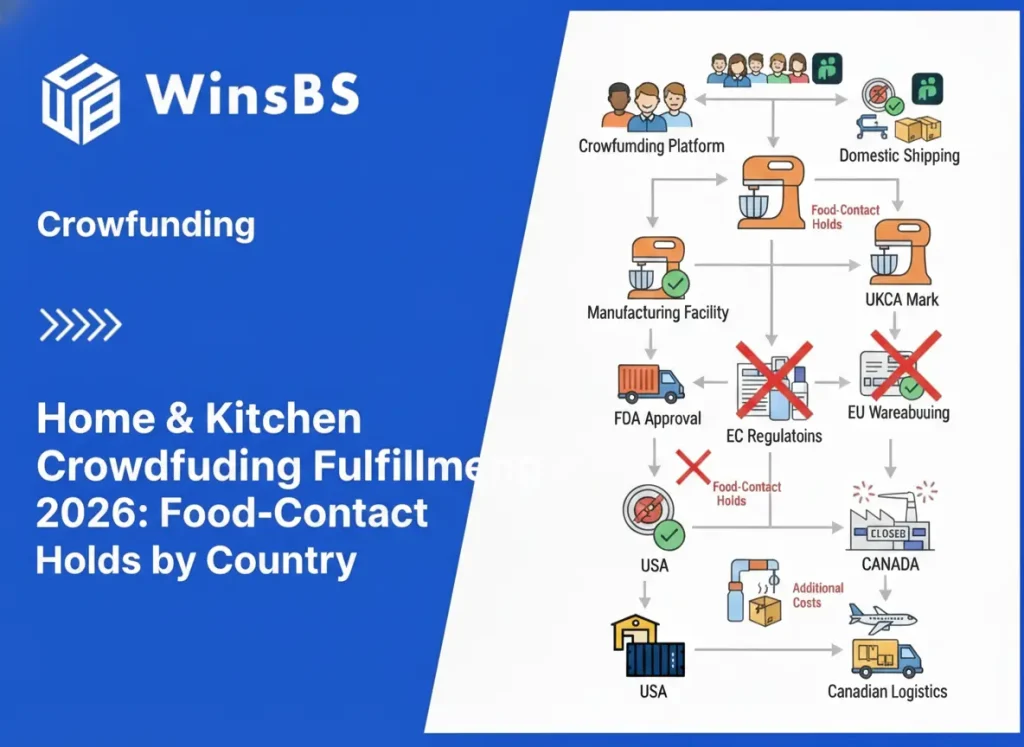
Home & Kitchen Crowdfunding Fulfillment 2026: Food-Contact Holds by Country
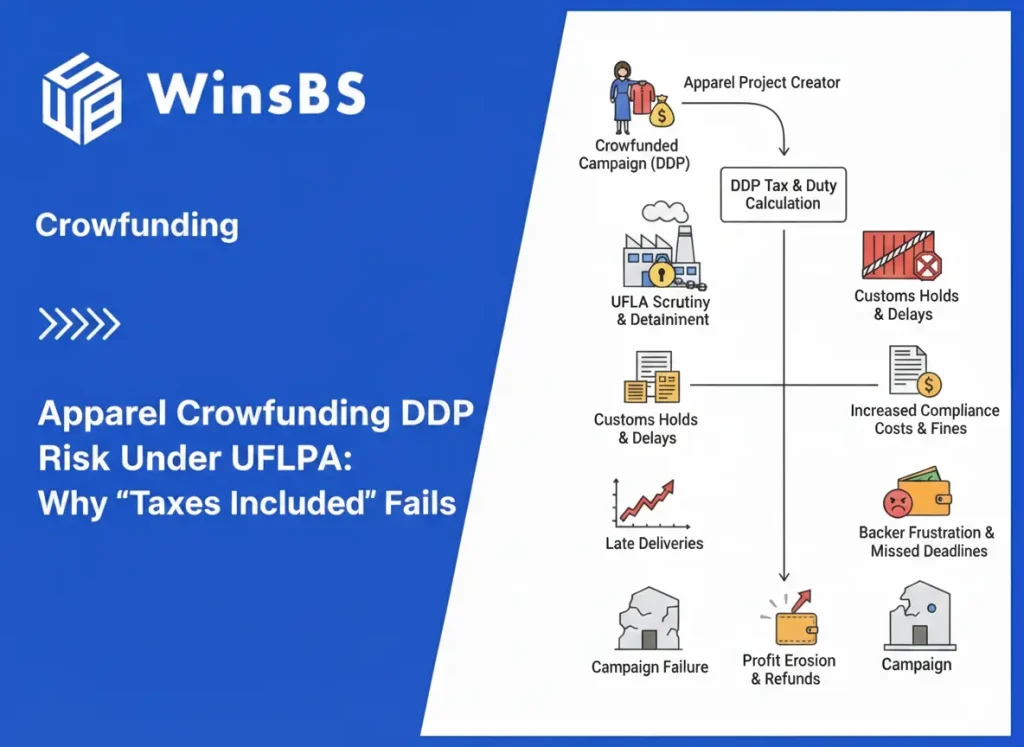
Home & Kitchen Crowdfunding Fulfillment by Country (2026) Food-Contact Holds: What DDP Actually Fixes — and Why Batches Still Get Stuck in the US, EU, UK, Canada & Australia WinsBS Fulfillment — Maxwell Anderson Updated February 2026 Quick Jump Why the Same Product Clears Fast in One Country but Freezes in Another The Real Trigger: It’s Admissibility, Not Just Shipping Where It Breaks in the Fulfillment Flow Key Regulatory Anchors (Quick References Only) The Core Failure Model: 3 Things Regulators Always Check How One Hold Snowballs into Delays and Replacement Loops Why Water Bottles Show This Problem Fastest (Real Example) 2026 Country Outcome Matrix: What Actually Happens Smart Moves for Your 2026 Campaigns Here’s the pattern we’re seeing every month in 2026: You go DDP (“Delivered Duty Paid”) to stop backers from getting hit with surprise fees at delivery — and it usually works. But when your Home & Kitchen reward involves anything that touches food or drink (water bottles, silicone lids, straws, coated pans, utensils, tableware), DDP doesn’t prevent long holds. We’ve watched the same exact product spec, same factory, same DDP setup behave completely differently: Australia often clears in 10–14 days, while the US, certain EU countries, or Canada can sit for 45+ days with tracking frozen on “under review.” This isn’t customs randomness — it’s a predictable admissibility checkpoint kicking in after duties are settled. Why Food-Contact Turns Shipping into a Market-Access Review Most creators mistakenly think “food contact = regulated like actual food.” That’s not how it works. Regulators aren’t checking because you’re shipping soup or coffee. They’re checking whether the surfaces that touch what people consume could transfer anything unsafe over time. Once that question is triggered (often risk-based or random), the shipment stops being treated as pure freight. It becomes a market-entry evaluation. Duties paid and tracking moving? Doesn’t matter if the batch can’t be fully defended on material identity, traceability, or responsibility. What we’ve seen in hundreds of 2025–2026 campaigns we supported: DDP eliminates 90%+ of doorstep fee complaints. But when food-contact scrutiny activates, admissibility rules override logistics. That’s why one country suddenly goes dark while others keep flowing. Where It Breaks: Execution Stages & Real Pain Points The fastest way to get surprised is assuming “cleared customs = delivered safely.” For food-contact items, many of the worst delays happen after initial entry or during post-market checks. Stage What Most Creators Assume What Actually Gets Tested What Backers Experience Pre-shipment (final BOM & packaging lock) Material specs are just internal notes Clear, consistent food-contact surfaces across every unit in the pledge configuration Hold later becomes unresolvable — the shipped mix can’t be matched to any single defensible description Entry / initial release DDP means automatic clearance Batch traceability readiness + who owns the material explanation Sudden document requests; timeline turns unpredictable Post-entry / market surveillance Tracking updated = everything is fine Risk-based checks on plastics, coatings, silicones, adhesives, inks Tracking freezes; delays appear only in certain countries Replacement waves Just reship the same configuration The same admissibility logic applies to replacements Loop repeats; support volume spikes and backer trust drops fast Key Regulatory Anchors (References Only) These holds aren’t random inspector moods — they’re tied to named, enforceable frameworks that treat food-contact items as market-access objects. In the US: FDA Packaging & Food Contact Substances (FCS) program and the Inventory of effective FCS notifications. In the EU: Framework Regulation (EC) No 1935/2004, with plastics specifically under Regulation (EU) No 10/2011. The Core Failure Model: Material Identity × Batch Traceability × Responsible Operator Holds only feel random when you’re tracking the wrong variables. In practice, three elements decide whether a batch moves or sits: Material Identity: Every food-touching surface (bottle body, lid plastic, silicone gasket, internal coating, straw, ink, adhesive) must be clearly and consistently documented — “food-grade” claims alone don’t cut it. Batch Traceability: Can you prove which exact units share the same material configuration? Crowdfunding often treats the entire production run as one big pool — that’s exactly what triggers scrutiny. Responsible Operator: Who in that market is accountable for defending the batch when questioned? If it’s unclear or “we’ll ask the factory later,” flow stops immediately. The Question We Answer Most Often “We paid everything with DDP — why are we still held?” DDP is a cost and delivery-experience tool. It doesn’t prove your batch is admissible. When a material question arises, someone has to own the full explanation — quickly and credibly. How One Hold Turns into Wave Freezes and Replacement Loops Crowdfunding ships one unified pledge identity across multiple markets. When scrutiny hits in one country, fulfillment teams often pause additional waves to avoid sending more inventory into the same undefended question — or worse, giving mismatched explanations across borders. That creates visible unfairness: “Why did backers in France get theirs while mine is stuck?” Replacements re-enter the exact same admissibility logic. If the root issue (traceability gap, ambiguous responsibility) isn’t fixed, the hold repeats — and support tickets explode. We’ve seen campaigns lose 20–30% of backer goodwill and face refund pressure purely from this propagation effect. Why Water Bottles Expose the Problem Fastest Water bottles aren’t the only trigger — they’re just the most frequent example in crowdfunding because they pack multiple food-contact components into one reward: stainless or plastic body, internal coating, lid (often mixed plastics), silicone gasket, straw, print/ink, adhesives. Regulators rarely care about “a bottle” as a concept. They care whether the held batch can be mapped to one coherent, defensible configuration. When campaigns can’t provide that precision (due to variant mixing or late changes), the batch is treated as undefendable. The same logic applies to silicone utensils, coated cookware, bowls with seals, etc. — bottles simply hit the breaking point sooner and louder. 2026 Country Outcome Matrix: Real Execution Patterns This isn’t a legal comparison — it’s what actually happens in fulfillment when the same failure model hits different control points. Market Typical Trigger Point What Gets Checked Backer-Visible Outcome United States Entry