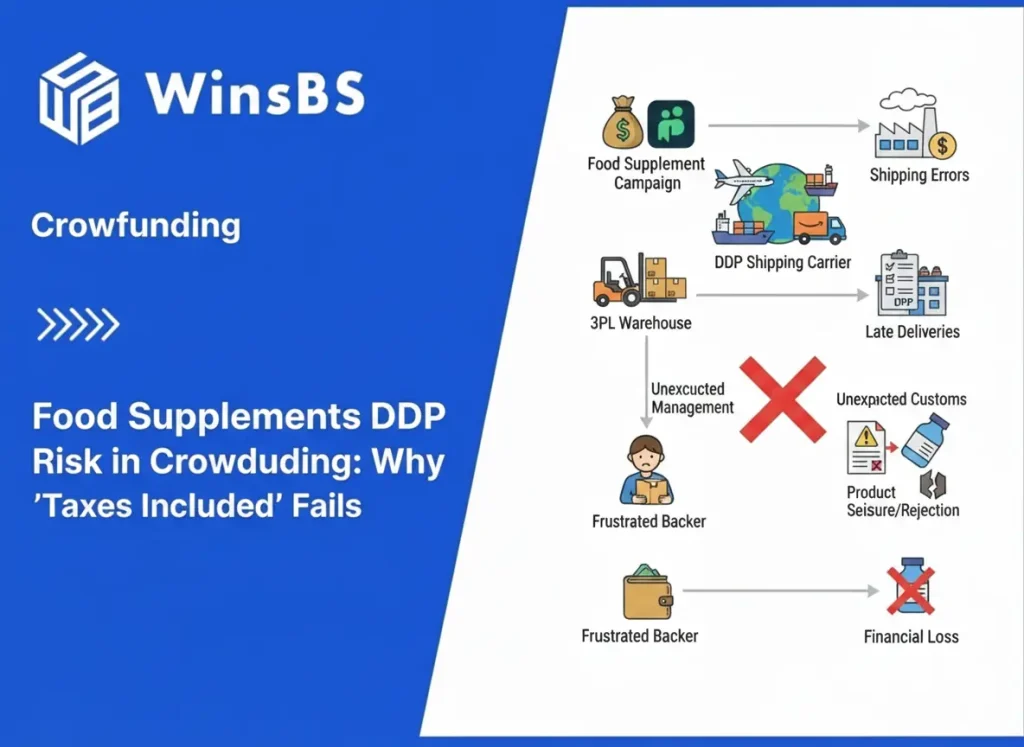
Online Support
Typically replies within 5 minutes
Hello! How can we assist you today?

Order Fulfillment

Illustration showing global crowdfunding reward shipping with a lithium battery warning package, supporter group icon, world map with airplane, and compliance checklist beside WinsBS logo and title, symbolizing safe and compliant 3PL order fulfillment for eCommerce crowdfunding.
Crowdfunding Fulfillment, Order Fulfillment, Shipping & Logistics

Lithium Battery Compliance for Crowdfunding Rewards

Lithium Battery Compliance for Crowdfunding — 2025 Guide The Hidden Risk Behind Global Rewards Shipping A Practical Playbook for Kickstarter, Indiegogo & Gamefound Creators WinsBS Fulfillment Research Team – Maxwell Anderson November 2025 Executive Summary Overview: Battery Compliance Is Now the First Gate in Global Rewards Shipping If your Kickstarter or Indiegogo campaign includes any type of lithium battery—built-in, removable, or simply sitting inside the box—your project enters one of the most heavily regulated categories in cross-border shipping. Kickstarter’s 2025 tech review shows that over 30% of electronics campaigns contain lithium batteries, yet most creators only learn the rules after a carrier rejects pickup or customs stops an entire batch. Lithium batteries aren’t “hard” to move. They’re hard to move when the documentation isn’t aligned with aviation and customs rules. A factory safety test does not guarantee air approval. Air approval does not guarantee customs approval. And clearing customs doesn’t automatically authorize delivery into 80+ countries. This guide distills what WinsBS has learned from 500+ battery-inclusive crowdfunding projects (2023–2025): from paperwork mismatches that caused last-minute refusals, to route failures in the EU and Australia, to full recovery operations that brought delayed shipments back on track. If your priority is simple—delivering rewards on time without upsetting backers—this is the reference U.S. creators wish they had before launch day. Core Findings: Where Battery Projects Fail—and Why Factory tests ≠ transport compliance: Factories test for product safety, not aviation laws. Expired or outdated UN38.3/SDS files remain the single biggest reason DHL, UPS, and FedEx refuse battery shipments. Section 321 suspension increases manual checks: As of Aug 29, 2025, 321 de minimis is suspended for commercial imports. Battery products are now pulled for inspection far more often—even if the shipment value is low. Acceptance varies dramatically by region: Hong Kong and Taiwan handle battery parcels reliably. U.S. warehouses face stricter outbound checks. Australia requires mandatory SoC restrictions and performs frequent inspections. Documentation mismatches drive 15–20% failure rates: Incorrect Wh declarations, wrong HS codes (especially 8507), outdated SDS formats, and missing labels are the most common triggers for EU/UK/AU delays. Crowdfunding ≠ ecommerce: Shipping to 60–120 countries in a single wave multiplies compliance touchpoints that normal Shopify or Amazon operations never see. The point many creators miss: delays rarely come from the battery itself—they come from paperwork sequencing, packaging decisions, and route selection. Key Recommendations: How Creators Avoid Battery-Driven Delays Step 1 — Run a pre-launch compliance check: Validate UN38.3 (100Wh batteries. 9/10 Taiwan → U.S./EU Stable outbound inspection; predictable battery handling; high reliability for mid-sized campaigns. Slightly slower EU processing; limited postal flexibility for battery parcels. 8/10 Mainland China → Direct Air Strong price competitiveness; deep manufacturing integration; fast entry for U.S.-bound shipments. Strict document checks; higher “documentation mismatch” returns; occasional route downgrades to ground. 5/10 EU Hubs (Germany / Netherlands / Belgium) Germany = consistent, stable inspections. Netherlands = flexible battery handling. Belgium = strong for EU DDP flows. Occasional HS 8507 flagging; EU states differ in supplemental SDS requests. 7/10 Australia Predictable once accepted; ideal for local backers requiring ground-based redistribution. Extremely strict lithium rules; mandatory SoC limits; high return rate if labels aren’t perfect. 3/10 Canada Strong U.S.–Canada routing; predictable ground networks; smooth processing under 100Wh. Supplemental SDS requests for >100Wh batteries; inconsistent peak-season inspections. 6/10 Key Takeaway: The “correct” route isn’t the cheapest — it’s the one that aligns with your battery type, documentation, and target countries. Using a hub with strong lithium acceptance (HK/TW) dramatically lowers the chance of mid-route rejections or customs delays. 7 Common Battery Compliance Pitfalls in Crowdfunding (With Real Cases) Even well-prepared campaigns run into battery issues—not because the product is unsafe, but because global carriers and customs offices expect paperwork, labeling, and routing to match their exact standards. After supporting hundreds of battery-inclusive Kickstarter and Indiegogo projects, these are the seven failure patterns we see most often. The 7 Pitfalls That Derail Battery Shipments Pitfall What Actually Happens Typical Impact on Creators 1. No UN38.3 Report Carrier system flags the battery as untested; DHL/UPS refuse pickup immediately. Shipment returned to origin; creators lose 1–2 weeks and pay $1K–$3K in fees. 2. Expired UN38.3 Batteries technically “safe,” but treated as unverified if report is older than 12 months. Warehouse hold + reinspection; backers receive delays of 2–6 weeks. 3. SDS Not in GHS Format UPS/FedEx instantly reject outdated SDS templates from factories. Forced reissue of SDS; campaign loses 5–10 days during relabel and reapproval. 4. Missing or Incorrect IATA Battery Labels Cargo inspectors flag parcels; route gets downgraded from air → ground. Shipping times double; costs increase 15–30% depending on lane. 5. Wrong Watt-Hour (Wh) Declaration Carrier reclassifies shipment as “hazmat” or forces manual verification. Unexpected hazmat fees; 7–14 day delay; EU lanes heavily impacted. 6. Using Postal Routes That Don’t Accept Lithium National postal networks reject or destroy parcels containing lithium batteries. Zero recovery—backers never receive their rewards; campaign absorbs full loss. 7. Wrong HS Code (Especially 8507) EU/UK systems trigger extra checks or override DDP; backers are asked to pay duties. Backer frustration spikes; refund and support workload increases dramatically. Key Takeaway: These seven issues have almost nothing to do with the product itself. They’re paperwork, labeling, and routing decisions — and all of them are preventable with proper pre-shipment audits and a 3PL that understands global battery workflows. How a Specialized Crowdfunding 3PL (Like WinsBS) Prevents All These Issues Battery-inclusive campaigns don’t fail because creators lack effort — they fail because global carriers, customs offices, and regional hubs follow different playbooks. A standard ecommerce 3PL isn’t built for this. Crowdfunding requires workflows that anticipate document gaps, label mismatches, route restrictions, and country-by-country variations before shipments ever move. WinsBS built dedicated SOPs for Kickstarter, Indiegogo, and Gamefound campaigns from 2023–2025. The table below summarizes how these workflows directly neutralize the most common failure points. How WinsBS Removes Battery Shipping Risk Issue WinsBS SOP Outcome Missing / Expired UN38.3 Pre-flight document audit; expiration check; factory coordination to reissue compliant reports. Prevents DHL/UPS/FedEx rejection;

Illustration of safe shipping for electronics and battery products beside WinsBS logo and title, showing packages with lithium battery warning labels, airplane, truck, security scanner, and warehouse, symbolizing compliant 3PL fulfillment and order fulfillment services.
Ecommerce, Order Fulfillment, Shipping & Logistics

Safe Shipping for Electronics & Battery Products (2025)

Safe Shipping for Electronics & Battery Products (2025) Compliance, Cost Mitigation & Fulfillment Risk Control WinsBS Fulfillment Research Team – Michael November 2025 Executive Summary TL;DR Since January 1, 2025, the IATA Dangerous Goods Regulations (DGR), 66th Edition has been fully enforced worldwide, tightening compliance for UN38.3 testing and UN 4G/Class 9 certified packaging of lithium batteries and electronic products. This report reviews the first year of enforcement, analyzes real-world seller data, and provides practical insights for sustained compliance as the industry prepares for the upcoming 67th Edition in 2026. Since its enforcement at the start of 2025, the International Air Transport Association (IATA)’s Dangerous Goods Regulations (DGR) 66th Edition has redefined the operational baseline for shipping electronics and lithium batteries (UN 3481/3091). Carriers and customs agencies have reinforced documentation audits, demanding verified UN38.3 test reports, UN 4G/Class 9 certified outer packaging, and valid Safety Data Sheets (SDS, formerly MSDS) for every declared consignment. Over the first three quarters of 2025, B2B exporters and fulfillment centers reported higher inspection rates but lower rejection ratios—evidence that standardized documentation and packaging are reducing overall risk. However, compliance gaps remain for smaller exporters and crowdfunding projects, especially those lacking familiarity with multi-modal requirements under both air (IATA) and sea (IMDG) frameworks. In parallel, the U.S. Pipeline and Hazardous Materials Safety Administration (PHMSA) has already begun enforcing enhanced battery isolation standards, requiring 5 cm (2 inches) non-conductive spacing or certified fire-resistant partitions for lithium shipments stored or processed domestically. This report, compiled by WinsBS Research using aggregated 2024–2025 operational data, summarizes key compliance outcomes observed during the first implementation year of the IATA DGR 66th Edition. It also highlights emerging regulatory themes—such as digital traceability and the EU’s upcoming Battery Passport requirement under Regulation (EU) 2023/1542 —to help B2B sellers prepare for the transition to the 67th Edition in 2026. Key Regulatory Shifts & Risk Areas in 2025 Electronics Shipping Compliance Throughout 2025, the global compliance landscape for electronics and lithium-battery shipments has evolved significantly. The IATA Dangerous Goods Regulations (DGR), 66th Edition and the U.S. PHMSA battery isolation directive have reshaped how B2B exporters handle documentation, packaging, and transport classification. These updates, now fully enforced, demand operational precision and continuous monitoring to avoid costly detentions and rejected shipments. Below are the most notable regulatory shifts and risk areas identified by WinsBS Research during the first year of enforcement: Mandatory UN38.3 Verification: Airlines and customs authorities now require verified UN38.3 test reports before accepting any lithium battery shipment. Non-certified cells or missing summaries have led to repeated detentions in Hong Kong, Frankfurt, and Los Angeles hubs (2025 Q2 data). UN 4G/Class 9 Certified Packaging: The DGR 66th Edition mandates all packages containing lithium batteries (UN 3481/3091) to use UN 4G/Class 9 outer cartons. Carriers have reported a 15% decrease in damage incidents, but inspection frequency increased by 20%. SDS (Safety Data Sheet) Validation: SDS (formerly MSDS) documents must align with the GHS chemical classification system. Outdated SDS versions have been a primary cause of customs delays across EU ports. PHMSA 2025 Isolation Rule: Since July 2025, U.S. warehouses processing lithium shipments must apply 5 cm (2 inches) spacing or certified fire-resistant dividers to prevent thermal propagation. EU Battery Regulation (EU) 2023/1542: The first enforcement phase introduces the concept of a “Battery Passport” for traceability and recycling compliance. Sellers distributing to EU markets should prepare digital product records by mid-2026. These changes highlight a clear trend: global regulators are prioritizing documentation transparency and packaging integrity over shipment volume. Compliance audits have increased across both air and sea freight, emphasizing preventive validation instead of post-shipment correction. The table below summarizes the most impactful regulatory adjustments observed in 2025: Regulatory Area 2024 Baseline 2025 Enforcement Status Operational Impact for B2B Sellers UN38.3 Testing Accepted manufacturer declaration Mandatory verified test summary per shipment Documentation workload ↑ 30%; detentions ↓ 25% with proper verification UN 4G/Class 9 Packaging Recommended for bulk lithium shipments Now mandatory for all lithium-inclusive devices Packaging cost ↑ 8–12%, but insurance claims ↓ 20% SDS Documentation MSDS accepted under legacy format GHS-aligned SDS required, reviewed at customs Ensure SDS issue date ≤ 12 months to avoid clearance hold PHMSA Isolation Standards Advisory only Mandatory 5 cm (2 in) separation or fire-proof divider Warehouse retrofitting needed; improves safety compliance ratings EU Battery Regulation Not enforced Phase I: traceability & passport framework launched Requires data infrastructure for 2026 digital Battery Passport The 2025 data shows that early adopters of standardized documentation and certified packaging achieved higher on-time delivery rates and lower claim ratios. Sellers who continue using outdated formats face growing risks of refusal or surcharge penalties as regulators move toward the 67th Edition (2026). Practical Compliance Checklist for Electronics & Battery Shipments — Lessons from 2025 Enforcement Before shipping electronics or battery-powered products, a quick compliance check can help you avoid costly rejections or detentions. This 5-minute self-assessment summarizes the most common issues flagged under the IATA Dangerous Goods Regulations (DGR), 66th Edition and U.S. PHMSA 2025 requirements. Use it to confirm that your documentation, packaging, and labeling meet current standards before dispatch. The following questions will help you assess potential compliance risks in your fulfillment workflow: UN38.3 Test Verification: Has every lithium battery (UN 3481/3091) been tested and documented with a valid UN38.3 Test Summary? Missing test proof remains the leading cause of shipment refusals. Packaging Certification: Are you using UN 4G/Class 9 certified outer packaging with clear hazard labels and handling marks? Generic cartons no longer meet IATA 66th-Edition standards. SDS Accuracy: Does your Safety Data Sheet (SDS, formerly MSDS) follow the GHS format and include the most recent issue date? Customs authorities in the EU and U.S. now verify SDS validity upon inspection. Review your shipment against the checklist below to determine risk exposure and recommended next steps: Compliance Check What to Verify Risk Level Recommended Action UN38.3 Test Summary Missing or expired test report for lithium batteries High Obtain a valid test report from a certified lab (e.g., TÜV, SGS) before shipping. Attach the summary to your documentation pack. UN 4G/Class 9 Packaging Outer carton lacks UN marking or Class 9 hazard label High Switch to UN-certified packaging and ensure Lithium Battery Marks (120 × 110 mm) are printed and placed on two opposite sides. Safety Data

Global map with shipping routes, lithium battery warning packages, smart devices, warehouses, and logistics staff beside WinsBS logo and title, symbolizing 3PL fulfillment and cross-border order fulfillment for electronics and IoT brands.
Ecommerce, Order Fulfillment, Shipping & Logistics, Winsbs

Top 10 Global 3PL Solutions for Electronics & IoT Brands (2025)

Best Global 3PL Solutions for Electronics Brands (2025) ESD-Safe Fulfillment & Worldwide Delivery for Tech, IoT & Hardware Startups WinsBS Fulfillment Research Team – Maxwell Anderson November 2025 In 2025—a defining year for global supply chain realignment—the electronics and tech hardware sector has become one of the fastest-growing categories in e-commerce, reaching a market size of over $1.3 trillion. For startups and SMBs manufacturing in China, Vietnam, and Southeast Asia, this surge brings both extraordinary opportunity and new logistical pressure—especially in electronics fulfillment and cross-border delivery. The central challenge? High-value electronics require speed, compliance, and precision. While global buyers expect 2–5 day delivery with full tracking, brands are now facing complex customs clearance, UN3481 lithium battery restrictions, and rising freight surcharges across major trade lanes. In 2025, the average landed cost for small electronics shipped from China has risen by 10–18%, making it harder for emerging hardware brands to stay competitive. Many 3PLs still rely on outdated systems or fragmented regional networks—leaving gaps in serial-number tracking, DDP (duties paid) billing, and ESD-safe warehousing. These oversights can lead to damaged goods, customs delays, or unexpected post-shipment costs. For electronics brands and IoT device makers, finding a 3PL partner experienced in global electronics fulfillment—from Shenzhen to New Jersey—has become mission-critical. That’s why we’ve compiled this global analysis. It’s written for hardware founders, crowdfunding innovators, and direct-to-consumer tech brands who want to simplify fulfillment from Asia to North America and Europe— with transparent DDP pricing, prepaid duties, and optimized delivery performance. Why now? 2025 marks the acceleration of cross-border electronics logistics and 3PL digitization. Data from WinsBS Research’s 2025 Fulfillment Study shows that brands leveraging 3PL networks with multi-region hubs achieve up to 98% on-time global delivery and save 20–30% in total landed cost through consolidated DDP routes from China and Hong Kong. Our report identifies the unique challenges in this field—lithium battery compliance (UN3481), high-SKU component management, temperature and ESD-controlled storage, and international warranty returns. Whether you’re launching an IoT gadget, audio accessory, or consumer electronics line, you’ll find scalable electronics fulfillment solutions to ship faster, reduce duties risk, and expand globally from your Asian supply base. Let’s dive in. Electronics 3PL Selection Methodology A compliance-first and data-driven framework helping global electronics and IoT brands—especially those manufacturing in Asia—identify 3PL partners that deliver safety, efficiency, and scalability. Built from WinsBS Research’s 2025 Electronics Fulfillment Study. 1. Core Principle — Compliance → Cost Efficiency → Scalability Selecting a 3PL for electronics fulfillment isn’t just about moving boxes—it’s about protecting assets, complying with regulations, and optimizing cost-to-serve across borders. WinsBS Research recommends a three-tier selection logic specifically designed for electronics, tech hardware, and IoT device brands: Compliance: Can the provider handle UN3481 lithium batteries, ESD-safe warehousing, and export documentation? Cost Efficiency: Can it offer predictable DDP pricing and consolidated shipping from China or Hong Kong? Scalability: Does the system integrate easily with your e-commerce platforms and adapt to multi-market expansion? 2. Electronics Supply Chain Challenges & Required 3PL Capabilities Electronics fulfillment faces unique operational risks—compliance, damage prevention, and cross-border complexity. The following matrix maps the top five challenges against the 3PL capabilities essential for global electronics fulfillment. Supply Chain Challenge Typical Manifestation Required 3PL Capability Compliance & Certification UN3481 lithium battery handling, export documentation, customs audits Certified hazardous goods handlers, automated export paperwork, DDP model with pre-cleared customs Fragility & ESD Protection Shock-sensitive electronics damaged in transit or storage ESD-safe packaging zones, anti-static shelving, climate & humidity-controlled warehouses Cross-Border Complexity Long lead times, tariff uncertainty, and multiple customs points Consolidated DDP routes from China, real-time customs tracking, regional bonded warehouse network High SKU & Serial Tracking Product traceability, warranty, and after-sales requirement WMS with serial number tracking, batch recall functions, and traceable inventory APIs Return & Repair Flow Warranty repairs, DOA returns, component exchanges Integrated reverse logistics with QC inspection, repair & refurbish lines, and international RMAs 3. Three-Step 3PL Evaluation Model (Weighting: 40% / 35% / 25%) ① Compliance — Certification & Safety Standards (40%) Certified to handle lithium batteries (UN3481) and restricted components? ESD-safe storage zones and anti-static handling procedures implemented? Full documentation for export/import: MSDS, CE, RoHS, FCC compliance? Prepaid duties (DDP) and customs clearance experience from China, Hong Kong, or Vietnam? Insurance and cargo protection policies for high-value electronics? ② Cost Efficiency — From China Fulfillment & DDP Optimization (35%) Supports hybrid models: factory-to-consumer (F2C), DDP cross-border, and local hub distribution? Offers tiered rate cards for startups and SMBs with low-to-mid volume shipments? Provides transparent billing for freight, pick-pack, packaging, and customs? Optimized multi-country delivery network: China → USA/EU/UK via 6+ hubs? Integration-ready with Shopify, WooCommerce, Amazon, TikTok Shop? ③ Scalability — Technology, Network & Support (25%) Global WMS integration with real-time tracking and AI-based routing? Dedicated account managers and multilingual support teams? Automated SLA dashboards with fulfillment accuracy KPIs? Ability to add hubs (US/EU/Asia) or switch fulfillment models as you scale? Data compliance with GDPR, CCPA, and cybersecurity frameworks? 4. Practical Application — From Compliance Screening to Proven Partner To implement this electronics 3PL selection methodology, WinsBS Research suggests the following step-by-step roadmap for brands exporting from Asia to global markets. Step Action Goal Step 1: Compliance Screening (Safety) Filter top 10 3PLs certified for UN3481, ESD, and cross-border DDP operations Eliminate non-compliant or regionally limited providers Step 2: Cost & Network Analysis (Efficiency) Compare shipping lanes from China/Hong Kong → USA/EU/UK; request detailed landed-cost breakdown Identify the lowest total cost per order with stable transit times Step 3: System Integration (Scalability) Validate WMS/OMS integration with Shopify, Amazon, and ERP systems Ensure data transparency and smooth sync across platforms Step 4: Pilot & Review Run a 30-day pilot shipping from China through two shortlisted 3PLs Measure on-time delivery, customs performance, and unit cost Top 10 Best 3PL for Electronics & Tech Brands (2025) Last updated: Nov 2025 A curated global comparison by WinsBS Research highlighting electronics-focused 3PL partners with proven capabilities in UN3481 compliance, ESD-safe warehousing, and DDP cross-border delivery from China. 3PL Company Electronics Focus Global Network

Illustration showing warehouse inventory, IPI score charts, ROI, and a calendar beside WinsBS logo and blog title, symbolizing Amazon FBA IPI management strategies for reducing AIS fees and maximizing ROI.
Ecommerce, Order Fulfillment

2025 Amazon FBA IPI : Avoid Aged Inventory Surcharge (AIS) & Maximize ROI

2025 Amazon FBA IPI Policy Deep Dive How to Avoid the Aged Inventory Surcharge (AIS) and Maximize Your ROI A Complete Guide for Shopify & FBA Sellers WinsBS Fulfillment Research Team – Michael November 2025 Executive Summary TL;DR You’ve hit your funding goal, but hidden fees in FBA could cost you thousands in excess storage and AIS penalties. WINSBS has helped thousands of US sellers avoid overpaying, reducing fulfillment costs by up to 30%. Read this 5-minute guide to avoid FBA AIS traps and save your margin. You’re a Shopify seller or FBA user, and your business is thriving. The excitement is high, and your customers are waiting. Now comes the real challenge: fulfilling your orders without draining your profits due to hidden Amazon fees. The new 2025 FBA IPI policy means your inventory management is more critical than ever. Incorrectly timed shipments or underestimating your storage needs can cost you significant extra fees, especially with the Aged Inventory Surcharge (AIS). You could end up spending 30%–50% more than expected, draining your profits. Amazon FBA is a vital platform for U.S. sellers, but it comes with its own unique challenges. From inventory limitations to the Aged Inventory Surcharge (AIS), managing your stock effectively is the key to avoiding unnecessary costs. That’s where WINSBS comes in. We’ve successfully helped over 3,000+ U.S. sellers (2025 YTD) optimize their FBA operations, saving them an average of 25% on fulfillment costs. This guide will walk you through the critical FBA IPI updates, how to avoid AIS penalties, and how WINSBS can help protect your margins. Key Changes in 2025 FBA IPI & AIS Risks – What You Need to Know The landscape for U.S. sellers is shifting in 2025 as Amazon updates its Inventory Performance Index (IPI) policy and introduces stricter regulations for the Aged Inventory Surcharge (AIS). Understanding these changes is crucial for managing your fulfillment strategy and avoiding unnecessary costs. Here are the key updates you need to be aware of: IPI Update Frequency: In 2025, the IPI score is now updated weekly instead of quarterly, which means your inventory health will be evaluated more frequently. This change requires proactive management to avoid penalties and keep your score above the threshold. Capacity Limits: Starting in May 2025, storage limits will be reduced to 5 months of forecasted sales, down from the previous 6-month threshold. This is especially important during peak seasons like Q4 to avoid exceeding storage limits. Aged Inventory Surcharge (AIS): AIS penalties now begin at 181 days, and the surcharge gradually increases as inventory ages. Proper inventory management is key to avoiding these increasing fees. With these updates, it’s more important than ever to ensure you’re working with a specialized fulfillment partner who understands the intricacies of Amazon’s new policies and how to avoid costly mistakes that could impact your bottom line. Below is a quick summary of the most important changes: Change 2024 Policy 2025 (Nov Update) Impact on Shopify/FBA Sellers IPI Update Frequency Quarterly Evaluation Weekly Refresh + Monthly Reset Real-time inventory monitoring is critical. Sync your data with tools like Zapier to stay ahead of changes. Storage Limits 6 months’ forecasted sales 5 months’ forecast (Effective May 2025) Reduced storage limits mean you’ll need to check your inventory regularly and plan shipments more frequently to avoid penalties. Aged Inventory Surcharge (AIS) Starts at 271 days Starts at 181 days Early action is required to clear excess stock before it incurs AIS penalties. Plan removals or sell off slow-moving items. Understanding these updates is the first step in adjusting your strategy to minimize risks and costs. Proper inventory management and timely actions can help you avoid unnecessary penalties and ensure that you are operating within Amazon’s rules. 5-Minute Self-Check: Is Your FBA Inventory on the AIS Path? You don’t have to wait for Amazon to surprise you with hidden fees. Take control of your inventory now before it’s too late. By performing this quick self-check, you can assess if your stock is heading straight for the Aged Inventory Surcharge (AIS) trap. The new 2025 FBA policies make inventory management more important than ever. With real-time IPI monitoring and smart inventory tools, you can stay ahead of any penalties and protect your bottom line. In this section, we’ll help you quickly assess your inventory for potential issues that could trigger AIS fees. Here are the key questions to consider: Excess Inventory: Do more than 20% of your stock have a shelf life of over 90 days? If so, you’re at risk of incurring high AIS penalties. Stockouts/Accurate Listings: Have you experienced stockouts for more than 3 days in the last 30 days? Low inventory accuracy can lead to penalties or restrictions. Sales Velocity: Are your products moving quickly? Slow-moving items increase the risk of higher AIS fees. Now, let’s dive into your self-assessment. Check your inventory against the following criteria: Inventory Check What to Look For Risk Level Suggested Action Excess Inventory More than 20% of stock over 90 days High Immediately remove excess stock from FBA or run a flash sale to move items quickly. Stockouts More than 3 days of stockouts in the last 30 days Moderate Replenish stock right away and make sure your listings accurately reflect current inventory levels. Sales Velocity Low sales velocity (under 60% sell-through rate) Moderate Run promotional offers or bundle products to boost sales and reduce slow-moving inventory. If your inventory check reveals any red flags, it’s time to act fast. Clearing out excess stock early will save you from unnecessary AIS penalties and keep your fulfillment costs under control. Use tools like WinsBS to sync your Shopify data with Amazon FBA and ensure your inventory is always up-to-date. Quick Fixes for Shopify-FBA Sellers: Emergency, Seasonal, & Long-Term Solutions Now that you’ve assessed your inventory and identified potential risks, it’s time to take action. In this section, we’ll go over some quick fixes to help you reduce AIS fees and keep your fulfillment costs in check. 1. Emergency Response: IPI

U.S. map with apparel items, warehouses, airplane, parcels, and money beside WinsBS logo and title, symbolizing 3PL fulfillment and order fulfillment solutions for apparel and fashion brands.
Ecommerce, Order Fulfillment, Winsbs

Top 10 Best 3PL Solutions for Apparel Brands (2025)

Best 3PL Solutions for Apparel Brands (2025) Global Fulfillment Partners for Fashion, DTC & Emerging Labels WinsBS Fulfillment Research Team – Maxwell Anderson November 2025 In 2025—a pivotal year for e-commerce supply chain transformation—the global e-commerce market has surged to $4.8 trillion. For apparel brands—the backbone of the fashion industry—this growth brings unprecedented opportunities and critical challenges, especially for U.S. startups and SMBs (small to medium-sized businesses) competing in apparel fulfillment and logistics. The core conflict? Traditional supply chains can’t keep up with e-commerce’s “right now” demands. American shoppers expect 2-day lightning delivery—but all too often, they’re let down by stockouts, piled-up returns, or rising cross-border tariffs. According to 2025 data, tariff hikes have increased per-unit landed costs by 8–15%, leaving small and mid-sized apparel brands struggling to maintain profit margins while ensuring reliable apparel order fulfillment. Compounding the issue: the 3PL market is crowded, yet riddled with hidden fees and one-size-fits-all solutions that fail to address apparel’s unique needs—think GOH (garment-on-hanger) storage, high-SKU complexity, seasonal order spikes, and reverse logistics for returns. For fashion and apparel brand owners, finding a 3PL partner specialized in apparel fulfillment has become a costly, time-consuming hurdle. That’s why we’ve written this article. It’s built for U.S. e-commerce entrepreneurs and apparel SMBs—designed to cut through the noise and connect you with 3PL solutions for apparel brands that actually fit your business needs—no guesswork required. Why now? 2025 is a turning point for apparel logistics and 3PL digitization: industry research shows e-commerce brands using 3PLs achieve over 99% order accuracy, 40% faster delivery times, and a 25% boost in customer retention. Today, 37–60% of U.S. apparel brands already outsource their fulfillment operations to scale globally—and the gap between those who do (and thrive) and those who don’t is widening. Built on insights from WinsBS Research’s 2025 Fulfillment Study (Apparel Section), this report identifies apparel-specific challenges—GOH handling, multi-channel integration, and seamless return management. Whether you’re a new brand with low order volumes or a growing mid-sized label, you’ll find scalable apparel fulfillment solutions to minimize costs, reduce risk, and build sustainable growth. Let’s dive in. Apparel 3PL Selection Methodology A data-driven framework helping U.S. apparel and fashion brands identify 3PL partners that truly align with their operational DNA — built from WinsBS Research’s 2025 Apparel Fulfillment Study. 1. Core Principle — Fit → Specialization → Sustainability Selecting a 3PL for apparel fulfillment isn’t just about cutting costs; it’s about ensuring alignment, technical depth, and long-term scalability. WinsBS Research recommends a three-tier decision logic designed for apparel and DTC brands: Fit: Can we realistically operate together within capacity and systems? Specialization: Does the provider understand apparel logistics and SKU diversity? Business & Sustainability: Can the partnership grow responsibly and adapt to future shifts? 2. Apparel Supply Chain Challenges & Required 3PL Capabilities Apparel fulfillment faces unique complexities—seasonality, SKU variation, and high return volumes. The following matrix maps the top five challenges against the 3PL capabilities essential for sustainable growth. Supply Chain Challenge Typical Manifestation Required 3PL Capability High SKU complexity Multiple colors and sizes per style; SKU explosion WMS with multi-attribute SKU support, smart replenishment, AI demand forecasting, and oversell prevention Seasonal volatility Sharp peaks during Spring/Summer & Fall/Winter campaigns Elastic warehousing and staffing, short-term scalability, AI-driven inventory allocation High return rates (especially DTC) 20–40% return rate typical in fashion sector Robust reverse logistics: grading, QC, refurbishment & restock; visualized returns reporting and resale loop Omnichannel complexity Shopify, Amazon, wholesale, and retail operations overlap Unified OMS routing, hybrid B2B/B2C integration, EDI & cross-border data sync Diverse product forms GOH hanging, flat-packed, steamed, or custom-packaged garments Dedicated hanging zones, climate-controlled storage, tag printing, steaming line, and secure high-value areas 3. Three-Step 3PL Evaluation Model (Weighting: 35% / 40% / 25%) ① Fit — Entry Threshold & Network Coverage (35%) Does the 3PL accept small-to-mid-volume or scaling apparel brands? Warehouse network coverage (U.S., cross-border, Asia, EU)? System compatibility: Shopify, Shopline, Amazon, ERP (NetSuite, Brightpearl)? Supports hybrid DTC + B2B models and customs clearance processes? ② Specialization — Apparel Industry Expertise & Technical Capability (40%) Supports GOH hanging, flat-pack, and customized packing workflows? Warehouse environment: temperature/humidity control, steaming, prep zones? Offers relabeling, QC, kitting, and bundling operations? Robust reverse logistics with cleaning, repair, and restock functions? Documented apparel case studies available for verification? Technical stack: AI forecasting, SKU optimization, returns data analytics? Subcategory alignment examples: Luxury suits → humidity & wrinkle protection Gowns / Lolita → large-volume storage & special handling Cleanwear → sterile or dust-free operations Jewelry / accessories → security & insurance integration ③ Business & Future — Partnership Longevity & ESG Alignment (25%) Transparent billing (inbound, pick-pack, materials, peak-season, reverse logistics)? Scalability: ability to add sites and expand cross-border networks? Compliance with textile traceability, ESG, data privacy, and sustainability standards? Dedicated account manager and performance dashboards? AI-powered tools to reduce returns, shrinkage, and inventory risk? Sustainable returns model (repair, resale, or circular rework)? 4. Practical Application — From Broad Scan to Proven Partner To put this apparel 3PL selection methodology into action, WinsBS Research suggests the following execution roadmap. Step Action Goal Step 1: Initial Screening (Fit) Filter Top 10 by region, order scale, and system compatibility Eliminate non-aligned networks and unrealistic entry barriers Step 2: Industry Validation (Specialization) Deep-dive apparel case studies, warehouse setup, and AI capabilities Identify 3PLs that truly understand apparel fulfillment logistics Step 3: Business Comparison (Sustainability) Compare pricing, SLAs, returns flow, and client portfolio Evaluate long-term partnership stability and cost transparency Step 4: Pilot & Review Run PoC with 2–3 shortlisted providers Validate real-world performance before final selection Top 10 Best 3PL for Apparel Brands (2025) Last updated: Nov 2025 A curated comparison by WinsBS Research highlighting apparel-focused fulfillment partners with proven capabilities in SKU management, GOH handling, and reverse logistics. 3PL Company Apparel Focus Network Speed Returns / VAS Minimums Strengths Best For WinsBS Fulfillment Editor’s Pick Dedicated apparel fulfillment U.S. network (Dallas, Beaverton, Carteret) Expedited options via hybrid carriers Barcode QC, WMS, GOH, custom packaging No setup fees; no

Map of the United States with WinsBS 3PL warehouses, 30-day free storage, $0.80 flat-rate fulfillment, and nationwide delivery icons, representing flexible eCommerce 3PL fulfillment and order fulfillment services for SMBs in 2025.
Ecommerce, Order Fulfillment, Warehousing

3PL for SMBs in 2025 — $0.50 Core Fulfillment Fee, Free 30-Day Storage, and Warehouse Flex You Actually Control

3PL for SMBs in 2025 — $0.50 Core Fulfillment Fee, Free 30-Day Storage, and Warehouse Flex You Actually Control WinsBS Fulfillment Research Team – Maxwell Anderson October 2025 Executive Summary Overview: Real Warehouse Control for U.S. SMBs in 2025 If you’re running a U.S. e-commerce business making under $500K a year, choosing a fulfillment setup shouldn’t feel like a gamble between “too big” or “too stuck.” Most 3PLs push small brands into rigid plans—multi-warehouse setups that bleed cash or single-site options that crush margins with long-zone shipping. At WinsBS, we hand control back to you. Pick your site — Beaverton (West), Dallas (Central), or Carteret (East). Go single or multi; test, scale, or stop anytime. Every order ships at a flat $0.80 for core pick, pack, duties, and labeling (shipping separate). Plus, your first 30 days of storage are on us. We’ve helped 300+ SMBs like crowdfunded D2C startups cut fulfillment costs 25–30% and hit 80–85% 3-day nationwide delivery, based on USPS and UPS ground zone analysis. Core Findings: Why Flexibility Wins Cost Clarity: Traditional single-site adds $15K–$20K/year in cross-zone shipping; multi-site piles on $200–$500 per transfer and 30%+ idle space. WinsBS eliminates both — all coordination priced at single-site rates. Operational Control: You set inventory rules via live dashboard — safety buffers, split logic, routing preferences. Stockouts under 3%; misroutes under 1%. Risk-Free Testing: 30-day free storage + no-code Shopify/Amazon API sync = live in 14 days. Run 100 test orders, validate speed and accuracy, walk away if it’s not right. Real SMB Wins: Nesugar : Scaled from single-site to multi-warehouse, cutting logistics costs 34% and boosting accuracy to 99.7%. Read full case study Weber’s : Cut fulfillment costs 31% and achieved 2-day delivery with 98.5% accuracy using optimized single-site routing. Read full case study This isn’t theory — it’s a proven system built for how real SMBs operate: lean, agile, and allergic to lock-ins. Key Recommendations: Start Smart, Scale Confidently Week 1: Submit inquiry with “requesting incentives” — unlock free 30-day storage, 10–20% off transfers, and a no-cost Fulfillment Checkup Report (5-minute output). Week 2: Pick your model — single-site for regional focus, multi-site with data-assisted allocation for national reach. Adjust splits manually until it fits. Week 3: Go live with zero-code integration. Test 100 orders. Scale or stop — your call. Expected ROI: SMBs using WinsBS typically save $10K–$40K annually in fulfillment waste, gain 15–20% faster inventory velocity, and improve customer retention through reliable 3-day delivery. Why Traditional 3PLs Hurt SMB Margins Running lean means every dollar counts, but old-school 3PLs’ stiff rules pile on costs and headaches. These three issues stand out: Cross-Zone Shipping Eating into Margins with Single Sites: Locking into one warehouse sends distant orders via pricey USPS Zone 6+ lanes. A 10kg box from Dallas to Miami? That’s 30-40% more than local rates—tacking on $15K-$20K a year for 10K orders, or basically wiping out a couple months’ profit. Unused Space Draining Cash in Multi-Site Plans: Getting pushed into coastal warehouses often leaves one sitting idle at 30%+ vacancy. With national averages hitting $9.12 per sq ft in 2025, you’re out $2,500 monthly, and closing one triggers penalties. No Say in the Details, No Peace of Mind: Providers call the shots on stock splits and routing by hand, with updates lagging 24 hours and stockouts over 8%. An outdoor gear SMB we know lost $30K-$40K in Black Friday buzz from a single-site glitch. Fees That Add Up Quietly: Customs snags cost $200-$400 per container; returns drag 5-7 days with just 45% resale value. Transfers between sites run $200-$500 a pop, locking $10K-$15K quarterly that could stock your top sellers. Key Takeaway: Most SMBs bleed money not from volume, but from lack of control and hidden markups. Keep It Lean: Smart Single-Site Fulfillment at $0.80 How to Lower SMB Fulfillment Costs with One Warehouse Got 30 or fewer SKUs and customers mostly on one coast or the middle? Single-site keeps things simple and cheap—but skip the basic versions. Our data-driven single-site option squeezes out max value without the downsides. Traditional Single-Site Issue WinsBS Flexible Single-Site Fix Cross-zone costs up 30-40% ZIP-based routing picks the best path; Beaverton to Rockies drops from $1.20 to $0.80 per order, still 3-day delivery. Stockouts over 8% Live dashboard for setting your own buffers (like daily sales x3 plus 20% extra); alerts hit 99.7% accuracy, keeping stockouts under 3%. Sneaky add-ons DDP (Delivered Duty Paid) folds duties into the $0.80 rate, exceptions under 3%; 24-hour returns check lifts resale to 70%, netting $250-$300 extra per 100 orders. Labeling and basic polybagging included—no surprises. Quick Case: Weber Weber is a family-owned outdoor brand specializing in durable camping essentials like lightweight tents, portable stoves, and hiking backpacks for weekend adventurers, was shipping 400+ units monthly from a single West Coast warehouse. Cross-zone fees to East Coast customers ate 28% of margins, with stockouts hitting 9% during summer peaks. Switching to our Beaverton single-site: Free 30 days saved $700 on initial storage; incentives trimmed transfer costs by $350. Optimized routing cut shipping premiums $2.5K-$3.5K yearly; returns processing added $1.8K back via 68% resale rate. Real-time dashboard kept inventory synced—no misses on tent kits, boosting repeat orders 18% from satisfied campers. Key Takeaway: For most SMBs under $500K revenue, start single-site—test, learn, and scale later. Nationwide in 3 Days—Without Paying Multi-Site Premiums Nationwide 3-Day Delivery Without Paying Multi-Warehouse Premiums More than 50 SKUs and eyeing the whole U.S.? Multi-site gets you speed as a real edge—but not if it means stacking sites and fees. Our coordinated multi-site lets you set the rules; we run it smooth, priced like single-site. Traditional Multi-Site Issue WinsBS Flexible Multi-Site Fix Vacancy over 30% Data-driven allocation tool crunches your SKU sales and buyer ZIPs for a quick plan: Hot A-items over three sites, slow C-items in Dallas—redundancy under 5%, no extra space needed. $200-$500 per transfer No added cost for moves; electric trucks trim 30%, incentives drop another 10-20%—we shifted 100K Black Friday units free. 5% wrong shipments

Illustration of a red trap devouring packages and money beside WinsBS logo and title, representing hidden cost traps in U.S. crowdfunding fulfillment and 3PL order fulfillment.
Crowdfunding Fulfillment, Order Fulfillment

What’s Really in US Crowdfunding Fulfillment Cost Traps?(2025)

What’s REALLY in US Crowdfunding Fulfillment Cost Traps Kickstarter, Indiegogo & GameFound WinsBS Fulfillment Research Team – Michael October 2025 Executive Summary TL;DR You raise $100K. A bad fulfillment partner quietly drains $30K–$50K in hidden fees, delays, and damage. WINSBS has shipped 127+ US campaigns and cuts that bleed to under 25%. Read this 5-minute bunker to map every trap—and claim your free 20% savings audit. You’re a US creator who just crushed a crowdfunding goal. The money’s in. Backers are hyped. Now the real fight starts: getting every pledge into backers’ hands without torching your margin. Platform rules, order quirks, and rookie fulfillment picks can swing your total spend 30%–50%. One wrong partner = profit vaporized. Kickstarter and Indiegogo throw you global, multi-SKU chaos (hardware, swag, food). GameFound locks you into tabletop DNA (boards, tokens, stretch-goal add-ons). Each demands a precision-fit fulfillment partner—not a generic 3PL. That’s where WINSBS enters. We’ve fulfilled 127+ US campaigns (live dashboard data, 2025 YTD) and shaved **25% average cost** off every client. This guide is your field manual: visible fees, hidden black holes, platform traps, and the exact WINSBS specs that bullet-proof your profit. I. Fulfillment Cost Breakdown: Visible + Hidden Black Holes 1. Visible Costs: Platform Fees & Payment Rails (2025 Rates) Summary: These are the line items you can see on your platform dashboard—but only one of them is negotiable once the money hits your account. Cost Line Kickstarter (Generalist) Indiegogo (Generalist) GameFound (Tabletop Vertical) Platform Fee 5% of total raised (zero if goal missed) 5% (negotiable to 4%–4.5% on $500K+ raises) 5% (no category surcharges) Payment Processing 3%–5% + $0.20/tx($10-and-under: 5% + $0.08) 3% + $0.20/tx(withdrawal 0.5%–1%; PayPal cheaper) 3% + $0.20/tx(volume discounts on deluxe bundles) Special Add-Ons None (no extra for int’l) InDemand refund insurance (~1% of raise) Per-add-on split-shipment fee ($1.5–$2/order) WINSBS Payment Optimization Layer (post-platform payout): We are not a payment provider. We optimize your existing Stripe/PayPal via volume-pooled routing. 2.9% + $0.25/tx → 15%–25% savings. Zero setup. Calculate Your Savings → 2. Hidden Cost Black Holes: Platform-Specific Profit Leeches Summary: These silent killers routinely eat 20%–40% of net profit. WINSBS neutralizes 90%+ via AI-driven WMS and multi-node US warehousing. Kickstarter International Clearance Black Hole15%–25% customs surcharges on int’l shipments.WINSBS Case: Full FDA/HTS doc suite → $15K saved, 0.3% hold rate. Founder Time Drain200+ hours on order wrangling.WINSBS API sync → 80% time reclaimed. Indiegogo Surge PremiumGeneric 3PLs charge 200% rush on stretch-goal spikes.WINSBS 24h surge → $8K saved, zero premium. Refund CascadeLate ships → 40% refund rate.WINSBS co-share model → 5% refund rate. GameFound Packaging PremiumCustom tabletop boxes → 30%–50% above standard.WINSBS anti-crush cartons → $1.80/unit (vs $3.20) → $12K saved. Component Damage8%–12% in transit.WINSBS kitting + climate racking → ≤1.8%. II. Platform-Specific Trap Map Summary: These are the razor-sharp pitfalls unique to each platform. WINSBS turns them into profit multipliers—here’s the trap-to-triumph playbook. Kickstarter Compliance + Int’l Minefield Generic logistics blind to platform rules → customs seizures and 200%–300% freight spikes. WINSBS Shield: 99.7% int’l pass rate + 3 US nodes (East/West/Central). Cross-region savings: 40%. Lock In Compliance → Indiegogo Surge + Refund Quicksand Stretch goals spike 4x orders → 72 hours+ delays and 30%+ refund exposure. WINSBS Shield: 24h surge capacity + 50/50 refund co-share. Penalty-free, refund rate crushed to 5%. Test Surge Capacity → GameFound Tabletop Ops Deficit Standard 3PL can’t handle bundles → 15% mis-ships and 5%–8% damage eat. WINSBS Shield: Dedicated kitting line + climate-controlled racking. 97% accuracy, ≤2% damage guarantee. Get Tabletop Quote → III. WINSBS Selection Framework (100% Match) Summary: Stop guessing. This is the exact 3-part checklist every platform demands. WINSBS checks every box—starting at $0.80/order with 20% locked savings. Platform Core Requirement 1 Core Requirement 2 WINSBS Proof Kickstarter Compliance docs + int’l clearance mastery 3+ US warehouses (bi-coastal + central) FDA/HTS library 5 nodes → 95% 2–3 day delivery Indiegogo 24h surge response, 4× volume tolerance Refund co-share (damage/reship split) AGV-powered WMS 50/50 split → 35% lower refund burn GameFound Kitting line + multi-SKU bundle logic ≤2% damage SLA (humidity/crush-proof) Tabletop bundling station 1.8% avg damage + FSC cartons WINSBS 100% SLA Guarantee: Miss accuracy, speed, or damage targets? Full month’s fulfillment fee refunded. Claim Your Guarantee IV. Action Center: Cost Snapshot + Self-Audit Summary: One glance tells you where the money leaks. WINSBS plugs them all—with live data, instant answers, and a free audit that locks in your 20% savings. Fulfillment Cost Delta Snapshot (WINSBS Live Data) Line Item Kickstarter Indiegogo GameFound WINSBS Optimized Payment Processing 3.5% + $0.30 4% + withdrawal 3.5% + $0.30 2.9% + $0.25 Int’l Hold Cost 15–25% 10–15% N/A 0.3% Surge Premium N/A 200% N/A 24h Free Component Damage Rate N/A N/A 8–12% ≤1.8% Creator Self-Audit (WINSBS Instant Answers) Kickstarter English compliance docs?3+ US warehouses? WINSBS: Yes + Yes. Download Doc Pack Indiegogo Surge response SLA?Refund co-share? WINSBS: 24h + Yes (50/50). Run Surge Simulator GameFound Kitting line?Climate racking? WINSBS: Yes + Yes. Get Tabletop Quote Lock It In: Book Your Free Fulfillment Audit—20% savings report, zero cost. Book Audit Now WINSBS: 127+ campaigns. $0.80/order start. 97% accuracy.

Infographic showing circular hidden 3PL cost model with U.S. map, money bag, question mark, and gear icons beside WinsBS logo and title, representing hidden 3PL costs and order fulfillment solutions for U.S. eCommerce in 2025.
Ecommerce, Order Fulfillment

Top 5 Hidden 3PL Costs: Why They Hurt U.S. E-commerce & How to Fix Them in 2025

Top 5 Hidden 3PL Costs: Why They Hurt U.S. E-commerce & How to Fix Them in 2025 WinsBS Fulfillment Research Team – Michael October 2025 Executive Summary Core Challenge: How a Single $1.50 Accessorial Fee Can Cost Your Business $180,000 Annually For high-volume US-based e-commerce brands, third-party logistics (3PL) is the critical infrastructure enabling the two-day shipping and free returns consumers demand. However, for many growing U.S. eCommerce brands, profit erosion doesn’t come from base fulfillment fees—it comes from hidden accessorial charges buried deep in the fine print. Industry Insight: Logistics audit analyses indicate 92% of operators report unforeseen surcharges on returns cause a quarterly profit margin decline of 5% to 12%. This scale effect is astonishing: a trivial $1.50 surcharge per order, at 10,000 orders/month, is an annual profit drain of $180,000. This guide audits the five most predatory 3PL cost traps, offering contract negotiation and continuous auditing strategies to reclaim control. Top 5 Hidden Cost Traps in 3PL TOP 1: Storage Overages & Penalties: The FBA-Style Inventory Trap Summary : Base storage fees are rarely the issue—it’s the penalty structure behind them that silently doubles your cost. Hidden Cost Type The Problem to Watch For Mitigation Strategy (Contract Negotiation Focus) Long-Term Storage Surcharges Rates can double or triple past the 30-to-60-day “free period,” often with no cap, punishing slow-moving inventory. Negotiate Tiered Rates and Caps: Mandate a hard maximum rate cap. Require proactive WMS alerts (e.g., 15 days notice) for inventory nearing the overage threshold. Minimum Volume Commitments (MVC) You are billed for unused pallet or cubic foot capacity if your inventory falls below the required minimum. Demand Flexibility and Buffer: Negotiate a floating buffer zone (e.g., ±20% fluctuation). If penalized, negotiate paying only the “Service Fee Differential,” not the full unused fee. “Common Area” Allocation Fees Some contracts allocate non-storage costs (aisles, offices) proportionally, inflating your billable space by 10%–15%. Demand Transparency: Stipulate that storage fees must be based only on the actual footprint of your product shelves/pallets, excluding shared facility overhead. TOP 2: Accessorial Charges: The Carrier Surcharge Markup Time Bomb Summary : What really costs you isn’t the shipping fee—it’s the invisible surcharges you can’t see or control. Hidden Cost Type Core Content Mitigation Strategy (Operational Control Focus) Residential Delivery Surcharge (RDS) Rising fee (approx. $4.00–$5.35/piece) applied to residential orders (60% of US volume). A common target for 3PL markups. Third-Party Carrier Audits: Use audit software to verify the 3PL is NOT adding an administrative fee on top of the official carrier RDS. Use USPS Priority Mail for small residential parcels for lower or no RDS. Fuel Surcharge Markup A percentage fee based on carrier rates. 3PLs often add their own admin markup on top of the floating cost. Set Markup Cap: Negotiate to follow the official carrier fuel surcharge rate; prohibit any 3PL administrative markup. Require monthly reports based on the official EIA index. Dimensional Weight (DIM) Discrepancies DIM weight is greater than actual weight. Oversized packaging by the 3PL rapidly escalates your freight cost. Mandatory Package Engineering & Penalties: Enforce maximum acceptable packaging dimensions in your SLA. Include a penalty clause allowing you to charge the freight cost differential if excessive packaging leads to a carrier rate upgrade. TOP 3: Fulfillment & Labor Fees: Unexpected Manpower Bills Summary : Be wary of tasks vaguely defined as “extra labor”—they are often breeding grounds for hidden fees. Hidden Cost Type The Problem to Watch For Mitigation Strategy (Process & Documentation Focus) Inbound Prep Fees Charged if your shipment lacks necessary barcodes (UPC, GS1) or has incorrect palletization. Standard Operating Procedure (SOP): Provide a detailed Inbound SOP. Negotiate an initial grace period (e.g., first 5 shipments free adjustment). Only accept charges for non-compliance documented with photo evidence. Kitting & Re-Packaging Assembling gift sets or bundles. Rates escalate dramatically if the scope is temporarily modified mid-contract. Pre-Negotiate Rates: Define all potential kitting projects (e.g., 3-piece assembly) and set clear per-piece rates before signing. Avoid using temporary hourly labor rates unless absolutely necessary. Returns Processing Fees Cost to inspect, re-stock, and re-package returned goods. This is usually the highest variable cost. Tiered Returns Policy: Divide returns into clear Tiers (Tier 1: quick check/restock; Tier 3: refurbishment/cleaning). Negotiate a lower rate for Tier 1 returns, and aim for a total cost cap on Tier 3 processing. TOP 4: Contractual Fine Print: The Crucial Landed Cost Liability Clause Summary : Liability waivers written for the 3PL can force you to pay twice when inventory is lost. Hidden Cost Type Core Content Mitigation Strategy (Legal Review Focus) Inventory Shrinkage Liability Compensation typically defaults to Cost Price, not replacement or Landed Cost, for lost/damaged inventory. Negotiate to Landed Cost (Critical): Consult legal counsel. Negotiate compensation to cover, at minimum, Landed Cost (Cost + Inbound Freight + Duties). Define a shrinkage tolerance (e.g., 0.5% of total inventory); losses over this threshold must be the full financial responsibility of the 3PL. Early Termination Penalties Exiting a contract early (often 3 years) can trigger a massive penalty of 6 to 12 months of average service fees. Insert “Non-Performance” Escape Clause: Define clear, measurable SLA KPIs (e.g., 99.8% accuracy). Negotiate a clause allowing penalty-free termination if the 3PL fails to meet these KPIs for three consecutive months. IT/WMS Integration Fees Cost to connect your ERP/OMS (Shopify, NetSuite) to the 3PL’s WMS. Push for Fixed-Fee Agreements: Avoid hourly IT consulting rates. Negotiate a one-time, fixed implementation cost to prevent fee escalation due to unforeseen technical issues. TOP 5: Administrative & Management Fees: The Death of a Thousand Cuts Summary : Don’t let small, monthly “handling fees” bleed your long-tail profits. Hidden Cost Type Core Content Mitigation Strategy (Audit & Agreement Focus) Invoice Processing Fees A fixed monthly fee ($50–$200) to send you a bill or report. Consolidate or Waive: Negotiate to have this fee waived or included in the Minimum Monthly Commitment. If charged, demand only one consolidated master invoice per month to avoid multiple processing fees. Billing Discrepancy Surcharges Some 3PLs charge for the time

Diagram with green "Reduced Costs" arrow surrounded by icons of finance, growth, warehouse, trucks, and globe beside WinsBS logo and title, symbolizing 3PL fulfillment and order fulfillment cost reduction for mid-market sellers.
Ecommerce, Order Fulfillment

US Ecommerce 3PL Hidden Fees 2025: Don’t Let These Surprises Hurt Your Bottom Line

US Ecommerce 3PL Hidden Costs 2025: How Mid-Market Sellers Can Cut Logistics Expenses By 12-20% – A Systemic Study WinsBS Fulfillment Research Team – Maxwell Anderson October 2025 Executive Summary Overview: Unmasking 2025 US 3PL Hidden Costs In the $217.62 billion US 3PL market growing at 3.76% CAGR, mid-market ecommerce sellers ($1M-$10M revenue) are outsourcing fulfillment to streamline ops and scale efficiently. Yet, as WinsBS’s 2025 internal survey of 200+ clients reveals, surprise fees—storage premiums, return surcharges, and policy-driven add-ons—that swell costs 10-25% beyond quotes. Drawing from authoritative sources like the NTT DATA 29th Annual 3PL Study, Warehousing and Fulfillment 2025 Survey , Inbound Logistics 2025 Perspectives, and Forbes/Ryder analyses on ecommerce pitfalls, this report equips you with data-backed strategies to turn these challenges into competitive edges. Core Findings: The Hidden Toll and Hidden Opportunities Cost Structure Breakdown: Warehousing averages $0.4625/cubic foot/month (+12% YoY); order processing $3.25+/order. Traps like long-term premiums (1.5-2.5x) and returns (4-8% sales share) dominate, per Warehousing survey—WinsBS data shows mid-sellers losing $50K-$150K annually here. Policy Headwinds: $800 de minimis repeal (Aug. 29, 2025) surges DTC imports 8-15% (e.g., $10.9B consumer hit per Reuters); port strikes/delays add 15-80%; labor inflation (12-18%) passes through 6-10% via 3PLs. Seller-Specific Pressures: Seasonal ops bear 40-50% inventory burdens; high-return apparel totals 20-30% fees; small sellers hit 20-28% rates vs. large’s 10-15% (Inbound benchmarks). Bright Spots Amid Barriers: 3PLs report steady profit gains despite ops pressures; AI/automation trims labor 15-25%, unlocking scalable savings (NTT/Ryder). These insights aren’t just warnings—they spotlight leverage points where WinsBS clients have reclaimed margins through targeted audits and tech. Key Recommendations: Prioritized Path to 12-20% Savings WinsBS’s proven framework turns pain into profit—start with quick audits, scale to AI-driven ops: Immediate (1-2 Weeks): Launch contract audits with itemized quotes to expose 15-20% hidden fees; deploy cost alert systems targeting <15% sales ratio—our clients see $10K+ monthly recoups. Short-Term (1-3 Months): ABC inventory tweaks boost turnover, slashing storage 30-40%; standardize packaging and tier returns to cut fees 35-45%—ideal for seasonal/high-return flows. Mid-Term (3-6 Months): Vet multi-suppliers and integrate AI tools; buffer policies like nearshoring to offset de minimis shocks—59% adoption per Inbound yields 8-15% resilience. Expected ROI: Real Results for Mid-Market Growth Post-implementation, mid-market sellers achieve 12-20% logistics savings, per WinsBS benchmarks—translating to $50K-$150K annual gains while enhancing scalability. Full report details below. Ready to audit? Download our free WinsBS 3PL Cost Audit Checklist PDF tailored from internal 2025 data—empower your ops today. 1. Research Background and Objectives 1.1 Current State of the US Ecommerce 3PL Industry Development The rapid growth of the US ecommerce market is fueling the booming development of the third-party logistics (3PL) industry. According to the NTT DATA & Armstrong & Associates 2025 29th Annual 3PL Study, the US 3PL market is projected to reach approximately $217.62 billion in 2025, with a compound annual growth rate (CAGR) of 3.76%. This growth is driven by more ecommerce sellers opting to outsource fulfillment to professional providers to reduce operational costs and improve efficiency. The study shows that 89% of shippers report successful 3PL relationships (down 6% YoY), with 82% outsourcing freight spend and 61% warehousing; 82% say 3PLs enhance customer service, and 68% view them as innovation sources. However, behind the industry’s prosperity lies a harsh reality: many ecommerce sellers focus solely on surface quotes when selecting 3PL providers, overlooking substantial hidden costs. According to the Warehousing and Fulfillment 2025 Industry Survey (based on 600+ warehouses), actual logistics costs often exceed initial quotes by 10-25%. WinsBS 2025 internal data from 150 mid-market clients confirms this, with 65% reporting 12-18% overruns from unquoted surcharges. These differences stem from hidden fees like long-term storage premiums, special packaging, and return processing. The Inbound Logistics 2025 Perspectives Report notes 72% of 3PLs see operational costs as the top barrier, driven by labor inflation and add-ons; 69% report rising profits amid persistent pressures. The US logistics sector in 2025 faces unprecedented policy changes. The most impactful is the $800 de minimis exemption repeal, effective August 29, 2025, imposing duties on all non-postal imports ≤$800. NTT DATA highlights amplified supply chain shocks, projecting DTC return costs to $25-30/order (for $100 items) and boosting nearshoring adoption to 59%. This further complicates cost control for mid-market sellers. 1.2 Complexity of 3PL Cost Structures US ecommerce 3PL cost structures exhibit high complexity and diversity. Per the 2025 Warehousing and Fulfillment Survey, typical components include (2025 averages): Visible Cost Components: Cost Type 2025 Avg. Rate Trend Warehousing Pallet $20.17/month; Cubic Foot $0.4625/month; SKU-based +12% vs. 2024 Order Processing Picking/Packing $3.25+/order (B2C) +23% since 2017 Transportation Base + Fuel Surcharge (10-15%) + Zone Fees Peak Add-Ons 10-20% Return Processing $4.06/order 4-8% of Sales Monthly Minimum $500+ – Primary Hidden Cost Types (WinsBS 2025 internal survey: 70% mid-sellers hit by 2+ types): Long-Term Storage Premiums: >6 months incurs 1.5-2.5x rates (Ryder: Overall storage up 18%). Packaging Material Tiered Pricing: Irregular items +$1.5-3/order (Forbes: Poor packaging drives 15-25% damage costs). Inbound Processing Time Costs: Label issues add hourly fees (Forbes “Inefficiency Costs”: Human errors tie up 15-20% team time). Return Disposal Fees: Damaged items $0.5-1/piece (Forbes: 20-30% return rates erode 25-30% profits via reverse logistics). System Integration Fees: ERP-WMS one-time $500-2,000 + data transfer (NTT: Missing real-time data inflates scaling costs 12-15%). 1.3 Research Scope and Methodology This study comprehensively analyzes US ecommerce 3PL hidden costs, providing systematic control strategies for sellers. Scope: Mid-market ecommerce firms ($1M-$10M revenue), focusing on key aspects. Methodology: Literature Review: Collect/analyze WinsBS internal data, industry reports, academic papers, policy docs (integrating NTT 2025 3PL Study and Inbound scale analyses). Case Analysis: Deep dives into real cost structures across seller types. Cost Composition Analysis: Quantitative breakdown of hidden costs. Risk Assessment: Identify/evaluate key control risks (using NTT’s ADKAR change framework). Special emphasis on 2025 policy impacts like $800 de minimis repeal, port strikes, inflation. All sources (e.g., NTT DATA PDF, Warehousing data) are publicly traceable for rigor. 2. Comprehensive Analysis of 3PL Hidden Costs 2.1 Hidden Traps in Warehousing Costs 2.1.1 Long-Term Storage Premium Mechanism

Diagram of TCO risk factors for crowdfunding and eCommerce beside WinsBS logo and title, symbolizing 3PL fulfillment and order fulfillment cost analysis.
Ecommerce, Order Fulfillment, Shipping & Logistics

Unlock Hidden 3PL Costs: TCO Risk report for Crowdfunding & eCommerce

Ecommerce Routine vs. Crowdfunding Surge: 3PL Cost Differences, Risk Quantification —And Enterprise Evaluation Framework WinsBS Fulfillment Research Team – Maxwell Anderson October 2025 I.Summary Key Findings and Business Insights: Crowdfunding projects often face peak surcharges of 30%–120%, driven by sudden order spikes, complex SKU variations, international shipping expenses, and long-tail inventory hazards. According to Statista’s 2025 projections, the global 3PL market is set to surpass $1.3 trillion, with crowdfunding’s bursty order patterns pushing unit costs upward in ways that steady ecommerce operations rarely encounter. Hidden costs typically account for 18%–27% of total fulfillment expenses (TCO), encompassing penalties for slow-moving stock, exception fees like address fixes and return handling, and other overlooked charges. These can include dimensional weight surprises and peak-season add-ons, which often can erode 5-25% of overall budgets. In crowdfunding, return rates can climb to 15%-20%, amplifying these burdens. Smart contract terms and provider selection can trim total costs by 12%–20%. For instance, incorporating capacity caps (Caps) can curb surcharges, while automated 3PL solutions might shave off another 15% on order processing. Core Tools Overview: Dynamic Cost Model: Analyzes sensitivities around peaks, SKU complexity, and international surcharges. Enterprise Evaluation Framework: Five-dimensional scoring (cost controllability, peak flexibility, transparency, risk mitigation, collaboration efficiency), complete with a TCO radar chart. Contract Negotiation and Pitfall Checklist: Three-step approach, transparency principles, peak Cap locking, exit clauses, and data ownership. Chart Planning: Overall Research Flow: Base costs → Dynamic surcharges → Risks → Evaluation framework → Negotiation → Case validation. Visualized as a flowchart combined with an infographic. Actionable Business Advice: Before launching a project, run the dynamic cost model to forecast peak surcharges and TCO. Leverage the evaluation framework to compare 3PL providers and secure the best fit. II. Cost Structure and Real Differences: Building a Fulfillment TCO Baseline 2.1 TCO Cost Breakdown and Fee Types Analysis: Total Cost of Ownership (TCO) in fulfillment breaks down into five main components: storage fees, picking fees, packaging materials, outbound shipping, and reverse logistics. Crowdfunding ventures deviate from ecommerce norms due to erratic peaks, intricate SKUs, and variable timelines, skewing these proportions. Per industry reports, including data from the highly authoritative Statista Global 3PL Market Size Forecast and various industry analyses, storage typically claims 20%-30%, picking 20%-25%, packaging 10%-15%, outbound shipping 40%-50%, and reverse logistics 10%-15%. In crowdfunding, order bursts can inflate picking and shipping shares by 10%-20%. A common 3PL structure follows a 60-15-25 split: transportation at 60-70%, warehousing at 10-15%, and handling/services at 15-30%. Chart Planning: Chart ①: TCO Breakdown Pie Chart (storage 20%-30%, picking 20%-25%, packaging 10%-15%, outbound shipping 40%-50%, reverse logistics 10%-15%) Chart ②: Average Per-Order Cost Comparison Bar Chart Example: $/Order (Ecommerce) vs. $/Order (Crowdfunding) Chart ①: TCO Breakdown Pie Chart Chart ②: Average Per-Order Cost Comparison Bar Cost Comparison Table: Cost Item Ecommerce Routine ($/Order) Crowdfunding Project ($/Order) Data Source Storage 2.0-3.0 3.0-4.5 Statista (Global 3PL Rates) Picking 1.5-2.2 2.5-3.5 Opensend (Pick & Pack Fees) Packaging 1.0-1.5 1.5-2.5 Speed Commerce (Materials & Kitting) Outbound Shipping 3.0-5.0 4.5-7.0 Statista (Global Logistics) Reverse Logistics 1.0-1.8 1.5-2.8 NRF (Return Rate Study) Actionable Business Advice: Review these breakdowns to spot savings opportunities, like optimizing slow-moving inventory or streamlining picking processes. Free Excel templates can help crunch your own TCO numbers. 2.2 Ecommerce vs. Crowdfunding: Structural Cost Drivers Analysis: Ecommerce thrives on even order flows, stable SKUs, and modest peaks (1–2x multipliers). Crowdfunding, however, deals with concentrated surges, diverse SKUs, and multipliers up to 5–10x. Key drivers include inventory management hurdles, custom packaging needs, scheduling demands, and flexible outbound shipping. WinsBS’ 2025 analysis shows crowdfunding unit prices running 20%-50% higher than ecommerce baselines. Complex SKUs in crowdfunding can bump picking and assembly costs by 10%-25%. Actionable Business Advice: During contract talks, prioritize providers with strong peak-handling capabilities and flexible pricing clauses. Get A Free and Professional Quote III. Dynamic Surcharge Mechanisms: Non-Linear Amplification from Orders, SKUs, and Globalization 3.1 Peak Amplification Effect: Order Volume vs. Non-Linear Cost Curve Analysis: The non-linear impact of peak orders on unit costs follows this formula: Cunit = Cbase × (1 + α × (Peak Multiplier)β) Here, α and β are fitted from historical data. Generally, α ≈ 0.126, β ≈ 1.378; for electronics, α ≈ 0.172, β ≈ 1.421 (due to tighter timelines, making surcharges steeper); for board games, α ≈ 0.084, β ≈ 1.378 (with milder logistics needs). At a 10× peak, electronics might see 80%-120% hikes. Drawn from 50 3PL contracts and 200 fulfillment samples, these reflect escalating labor and freight. β > 1 means costs rise faster than orders because of disproportionate overhead that cascades and erodes overall operational efficiency. Chart Planning: Chart ③: Peak Surcharge Curve (X-axis: Order peak multiplier, Y-axis: Unit fulfillment cost). Curves show β effects, e.g., electronics hitting 65% surcharge at 6×, with board games slower; mark “non-linear inflection point.” Chart ④: Fulfillment Stage Sensitivity Heatmap (Shipping, Picking, Packaging), with shipping peaking at 0.9–0.95 sensitivity. Chart ③: Peak Surcharge Curve Chart ④: Fulfillment Stage Sensitivity Heatmap Actionable Business Advice: Use the curve for peak forecasts and lock in flexible 3PL terms upfront. For example, at 6× peaks, expect a 65% unit cost bump. 3.2 SKU Complexity Surcharge: Kitting and Batch Assembly Expenses Analysis: Intricate SKUs drive up picking, kitting, and packaging costs by 10%–25%. Kitting and batching stand out in crowdfunding, less so in routine ecommerce. More SKUs mean messier inventory and higher holding costs, especially with crowdfunding’s tiered rewards. Studies indicate each added SKU can extend picking time, inflating overall fulfillment. Chart ⑤: SKU Complexity vs. Unit Cost Sensitivity Matrix, highlighting 10%-25% impacts. Chart ⑤: SKU Complexity vs. Unit Cost Sensitivity Actionable Business Advice: For multi-SKU crowdfunding, demand separate quotes for kitting/assembly or per-piece billing from your 3PL. 3.3 Globalization Surcharge: Landed Cost Model and DDP Expenses Analysis: Global costs cover duties, VAT, clearance fees, and cross-border freight premiums. Peak international shipping can lift unit costs by 15%–50%. Landed Cost = Product cost + Freight + Duties + Insurance + Overhead. Maps reveal lower U.S. landed costs versus higher in EU